Desired Goal:
Review assumptions, compare design variations, to discover user preferences
The Tool's Purpose:
- Perform a true A/B test or several variants of a prototype in the form of a multi-variants test or as split testing.
- Do a quantitative evaluation.
- Carry out a qualitative survey and evaluate the number and content of feedbacks.
- Compare individual variants of a function or a prototype (e.g. buttons, visuals, arrangement).
Overview:
A/B Testing is a robust experimental method used in the design thinking and product development processes to validate assumptions by comparing two or more variants of a product, feature, or design element. The primary objective of A/B Testing is to determine which variant performs better in terms of user preferences, engagement, and overall effectiveness. This is achieved by exposing different segments of the target audience to each variant and measuring their interactions and responses through quantitative metrics and qualitative feedback. A/B Testing can be applied to both digital products, such as websites and mobile apps, and physical prototypes, allowing teams to make data-driven decisions that enhance user satisfaction and optimize performance. By systematically testing and comparing variants, teams can reduce uncertainty, minimize risks, and ensure that the final product aligns closely with user needs and market demands. This iterative approach not only refines the product’s features and design but also fosters a culture of continuous improvement and user-centric innovation within the organization.
Benefits:
Data-Driven Decision Making: Provides empirical evidence on which variant performs better, reducing reliance on intuition and assumptions.
Enhanced User Experience: Identifies the preferences and behaviors of users, allowing teams to tailor the product to better meet their needs.
Increased Conversion Rates: Optimizes key elements, such as call-to-action buttons or landing page layouts, to boost user engagement and conversion rates.
Risk Mitigation: Minimizes the risk of implementing ineffective features by validating them through testing before full-scale development or deployment.
Cost Efficiency: Saves time and resources by focusing development efforts on variants that have proven to be more effective.
Scalability: Enables testing of multiple variants simultaneously (multi-variant testing), providing comprehensive insights that can be scaled across different aspects of the product.
Improved Product Performance: Continuously enhances product functionality and design based on user feedback and performance metrics.
User-Centric Innovation: Ensures that product development is aligned with actual user preferences and behaviors, fostering a more user-centric approach.
Enhanced Collaboration: Encourages cross-functional teamwork by involving designers, developers, marketers, and stakeholders in the testing and analysis process.
Clear Insights and Metrics: Provides clear and measurable outcomes that help in understanding the impact of different design choices.

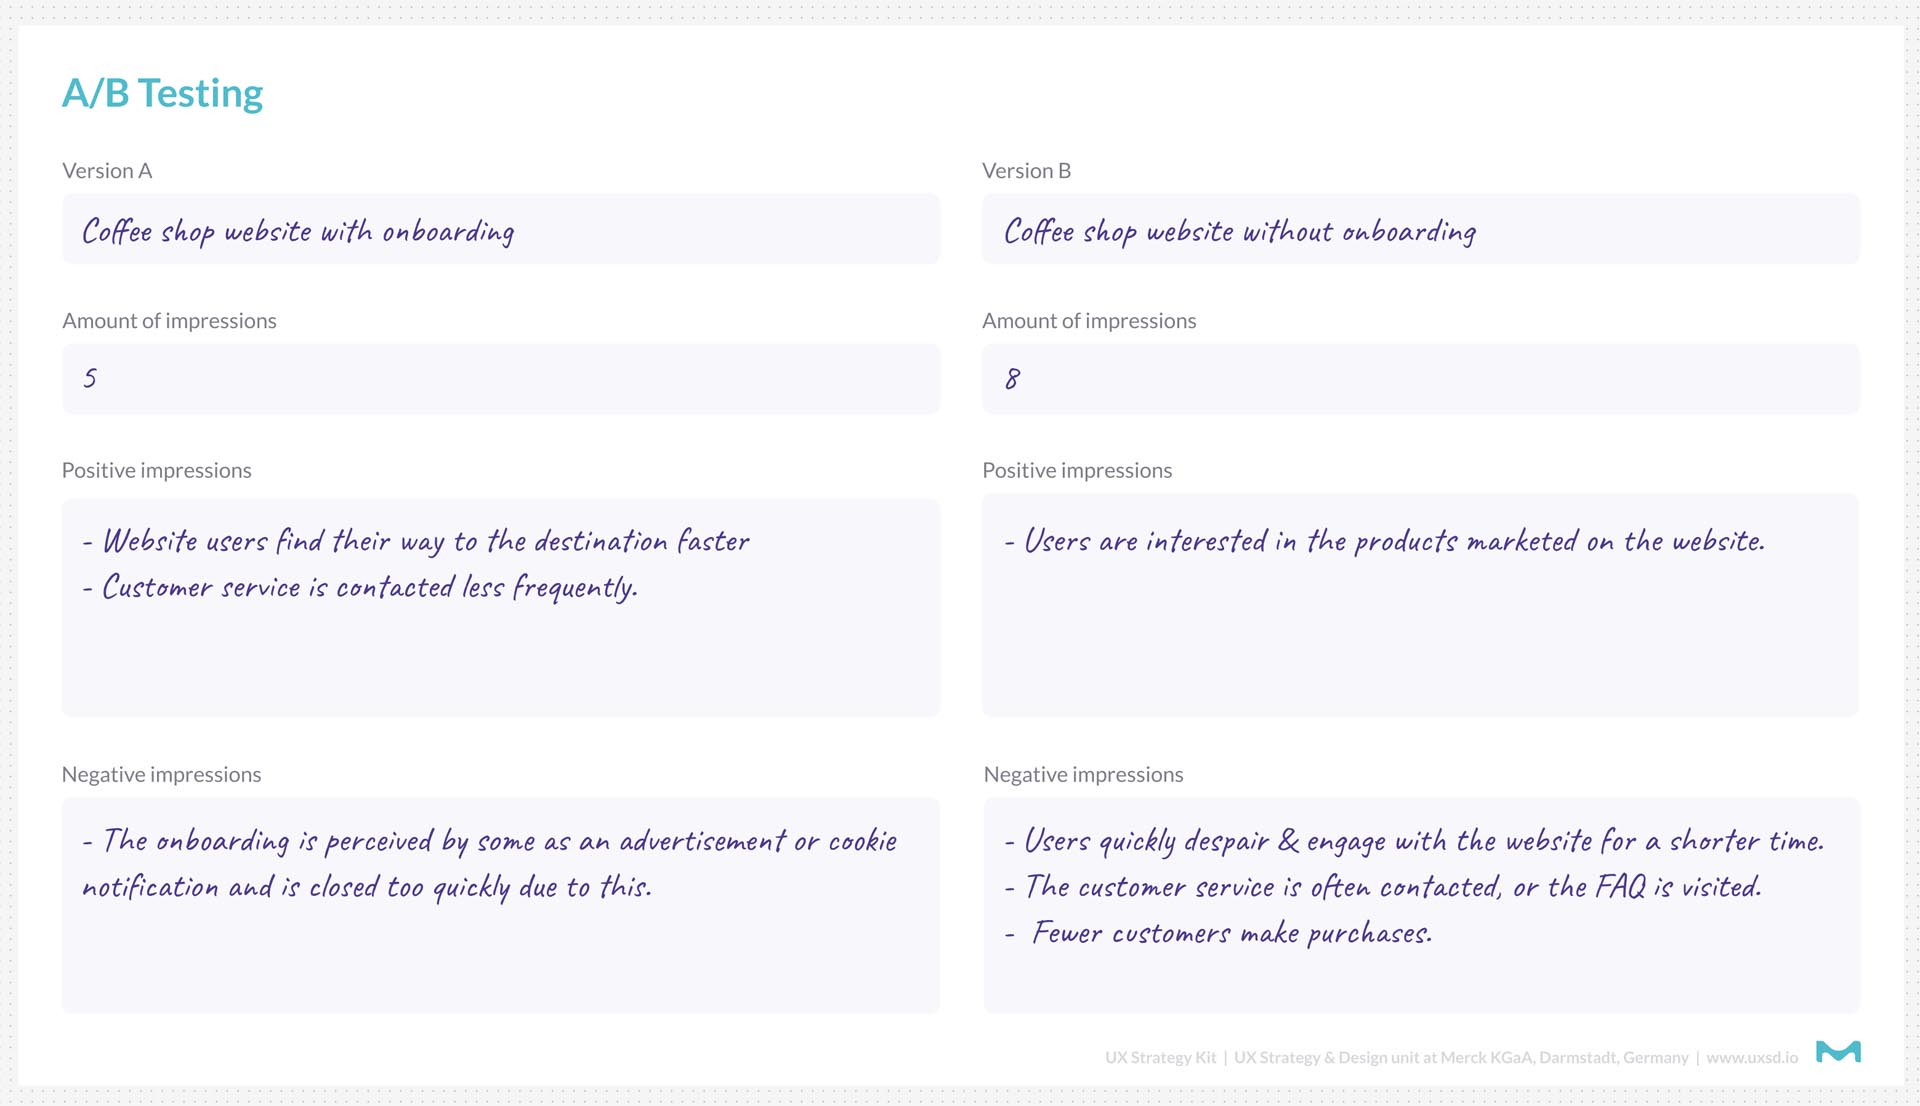
A/B Testing FigJam Exercise Template courtesy of Merck KGaA
Use Case Scenario:
Scenario: An e-commerce company aims to increase the conversion rate on its product pages. The marketing and design teams decide to implement A/B Testing to determine which version of the product page layout leads to higher sales and better user engagement.
Application:
- Objective: To identify which product page layout results in higher conversion rates and improved user engagement, thereby increasing overall sales.
- Conducting A/B Testing:
- Step 1: Define the Hypothesis:
- Hypothesis: Changing the layout of the product page to include larger product images and a simplified checkout process will increase the conversion rate.
- Step 2: Create Variants:
- Variant A (Control): The current product page layout with standard-sized images, detailed product descriptions, and a multi-step checkout process.
- Variant B (Test): A redesigned product page with larger, high-resolution images, concise product descriptions, and a streamlined, single-step checkout process.
- Step 3: Determine Metrics:
- Primary Metric: Conversion rate (percentage of visitors who make a purchase).
- Secondary Metrics: Average time spent on the page, bounce rate, and user satisfaction scores through post-purchase surveys.
- Step 4: Implement the Test:
- Audience Segmentation: Randomly assign incoming website visitors to either Variant A or Variant B to ensure unbiased results.
- Duration: Run the test for two weeks to collect sufficient data for statistical significance.
- Step 5: Collect and Analyze Data:
- Quantitative Evaluation: Measure the conversion rates and other metrics for both variants using analytics tools.
- Qualitative Feedback: Conduct user surveys to gather feedback on the new layout, focusing on ease of use and visual appeal.
- Step 6: Compare and Decide:
- Results: Variant B shows a 15% higher conversion rate, users spend 20% more time on the page, and bounce rates decrease by 10%. Survey feedback indicates that users find the larger images more appealing and the checkout process more convenient.
- Decision: Based on the positive results, the company decides to implement Variant B as the new standard product page layout.
- Step 1: Define the Hypothesis:
- Outcome:
- Increased Sales: The new product page layout leads to a significant increase in sales due to higher conversion rates.
- Improved User Engagement: Users engage more with the product images and spend more time exploring the product details.
- Enhanced User Satisfaction: Feedback from users highlights the improved visual appeal and the efficiency of the checkout process, leading to higher customer satisfaction.
- Scalable Insights: The successful implementation of the new layout encourages the company to conduct similar A/B Tests on other aspects of the website, such as homepage design and promotional banners, to further optimize user experience and sales performance.
- Strategic Decision-Making: The data-driven approach validates the effectiveness of the design changes, providing a clear justification for scaling and replicating successful strategies across different product lines.
Outcome: By utilizing the A/B Testing framework, the e-commerce company successfully identifies and implements a more effective product page layout that significantly increases conversion rates and enhances user engagement. This data-driven approach not only boosts sales but also provides valuable insights into user preferences, enabling the company to make informed decisions for future optimizations and maintain a competitive edge in the market.


