Desired Goal:
To identify opportunities stemming from a problem or desired outcome and map them to potential solutions, creating a structured approach to innovation.
The Tool's Objective:
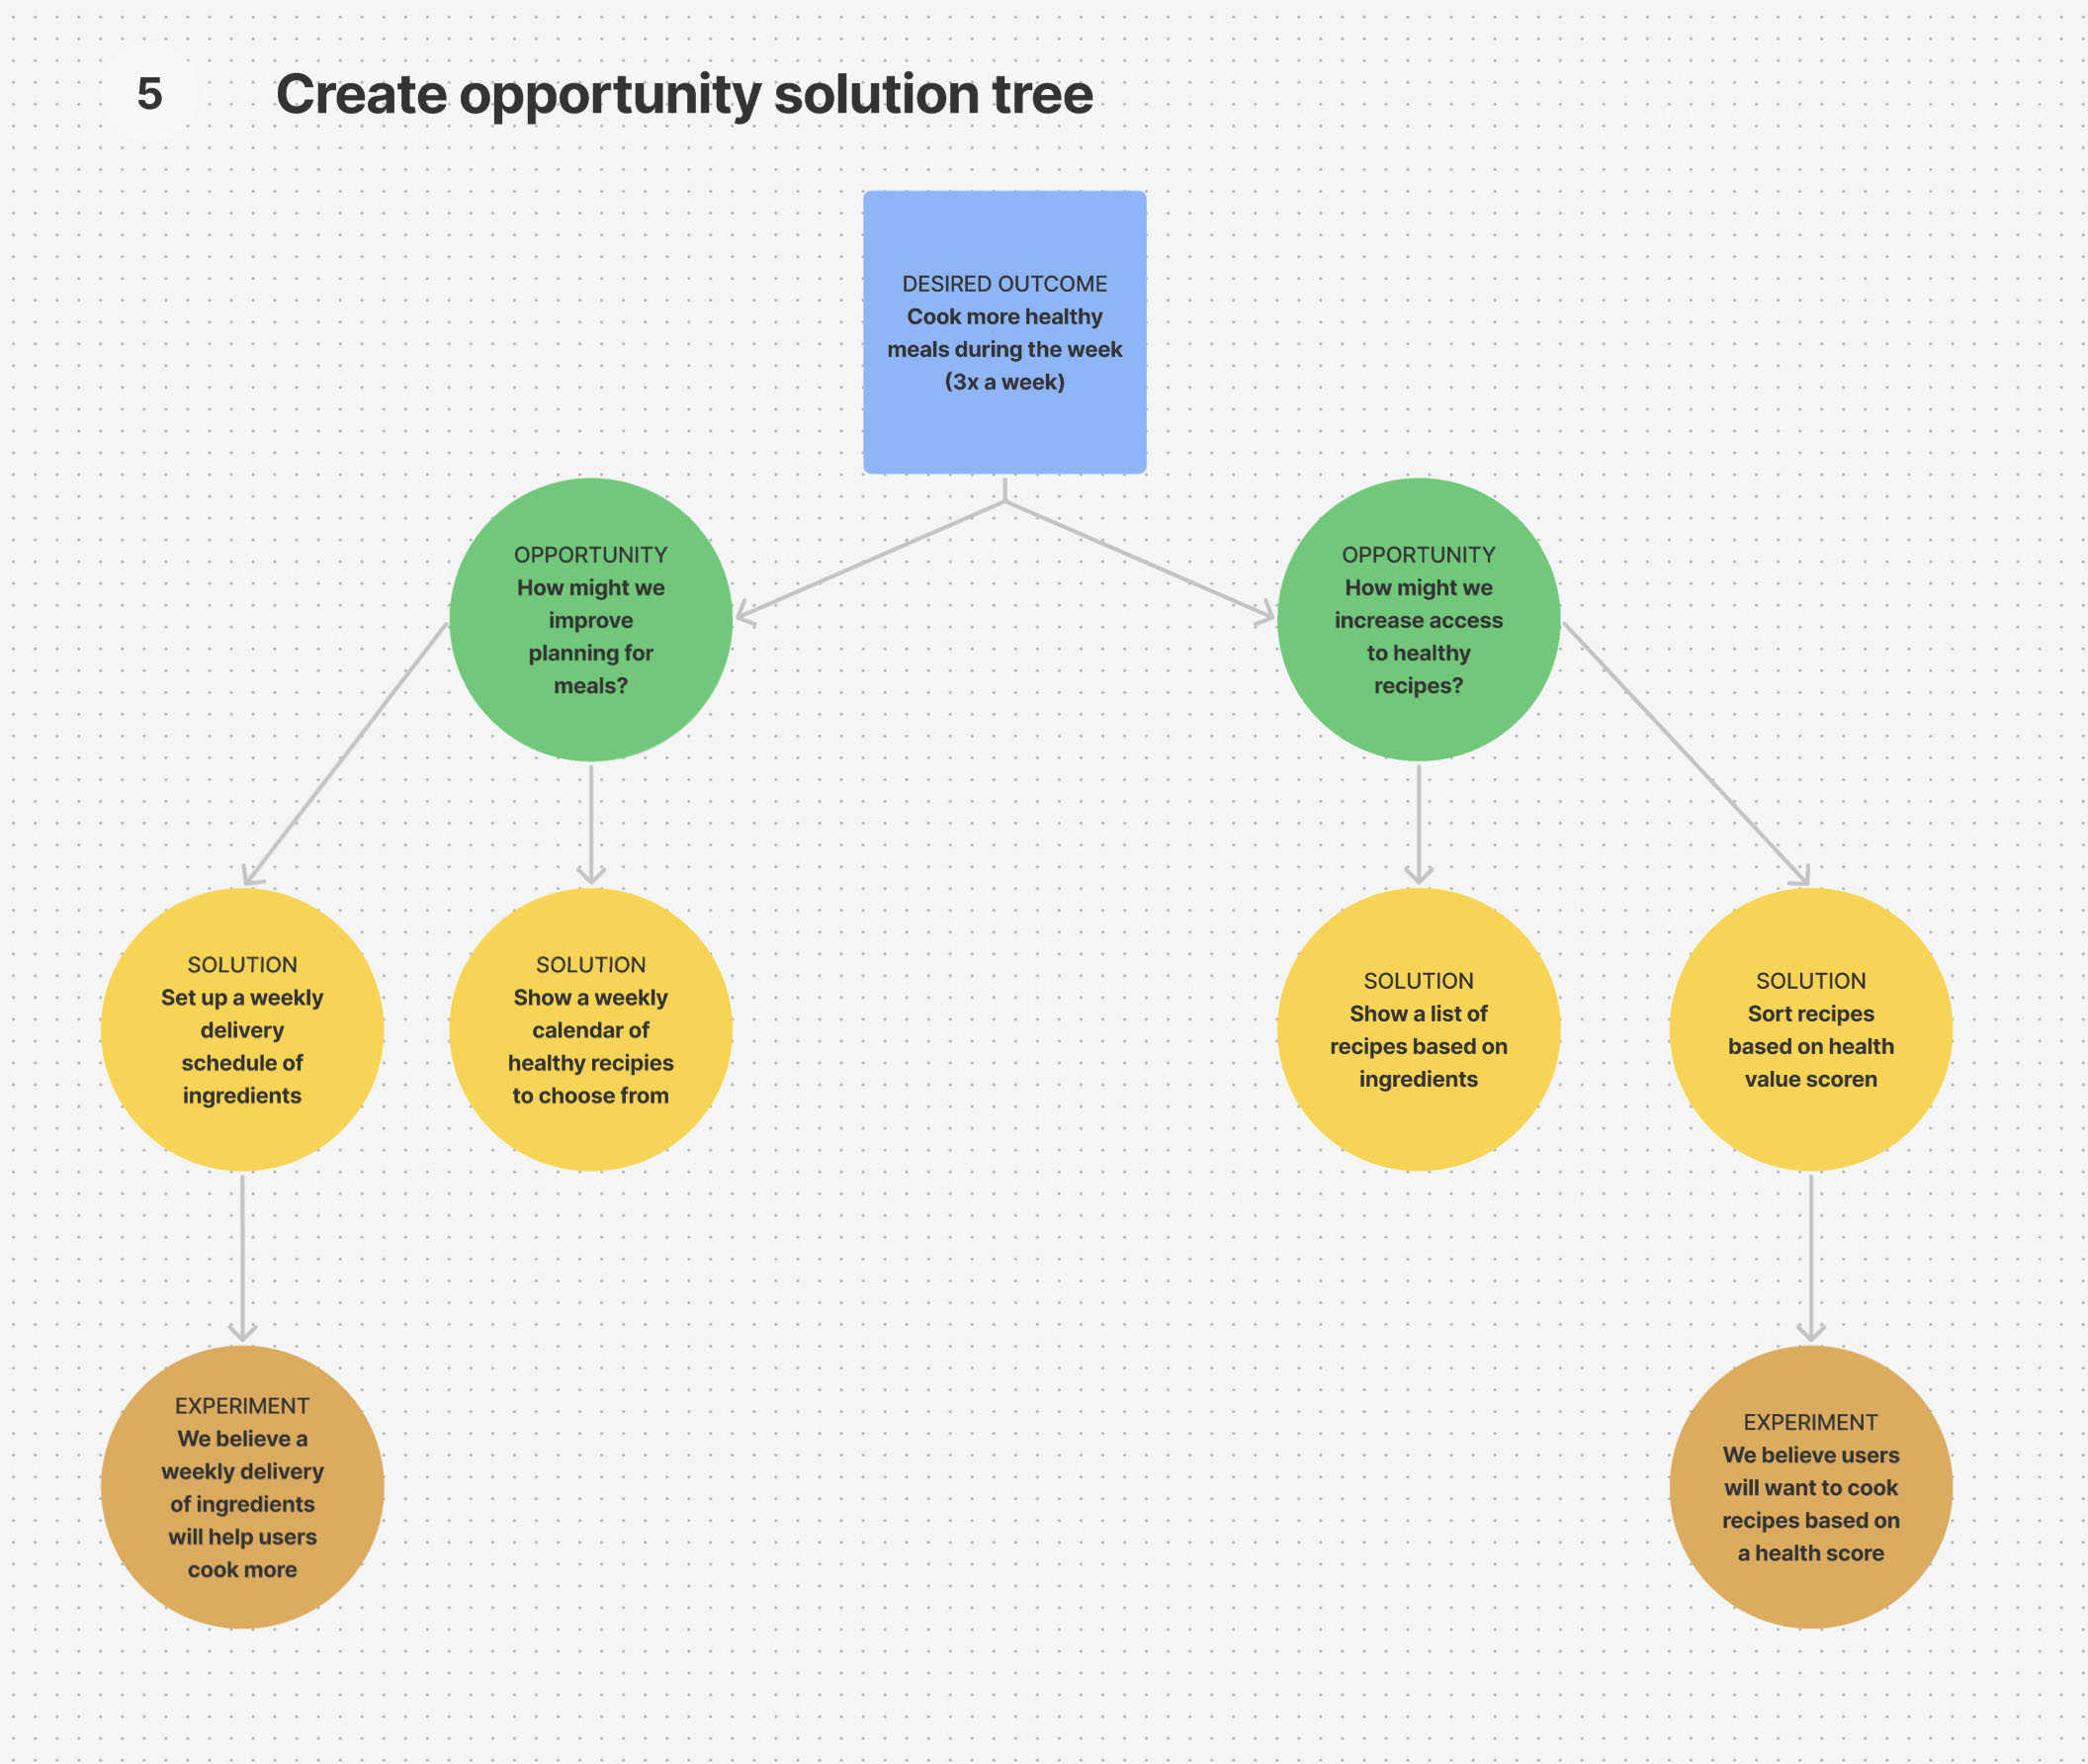
The Opportunity Solution Tree helps teams visualize the relationship between a problem or desired outcome, the opportunities it presents, and the solutions or hypotheses that can address them. This iterative tool guides strategic decision-making and ensures alignment with user needs.
Overview:
The Opportunity Solution Tree starts with a clearly defined problem or outcome at the root. Teams brainstorm and branch out into potential opportunities, focusing on different ways to address the problem or achieve the outcome. These opportunities are then further expanded into hypotheses and potential solutions. User feedback and testing are integrated into the process to refine or pivot solutions. The tree structure makes it easy to visualize and track how solutions connect back to user needs and business goals.
- SOLUTION
What are you attempting to solve? - HYPOTHESIS
We believe [blank] - DATA
How will you gather your data? Interviews, surveys, other? - AUDIENCE
Who will be your target audience? - DURATION
Duration of the experiment? - OUTCOME
This experiment will be successful if [define outcome] - RESULTS
Is the conclusion of the experiment: Validated, Invalidated, Inconclusive
List the results of the experiment - NEXT STEPS
If the hypothesis is true, then [describe how you want to move forward]
If the hypothesis is false, then [describe how you want to move forward]
If the hypothesis is inconclusive, then [describe how you want to move forward]
Benefits:
– Provides a clear, visual framework for linking problems, opportunities, and solutions.
– Encourages exploration of diverse opportunities.
– Aligns solutions with user needs and business outcomes.
– Helps prioritize efforts by focusing on high-impact opportunities.

Opportunity Solution Tree FigJam template courtesy of OpenTable
Use Case Example:
A GIS company aims to improve user engagement with their map visualization tool. At the root of the tree, they define the outcome: “Increase user engagement.” From there, they branch into opportunities like “improve map loading speed,” “enhance data layer customization,” and “simplify user interface.” Each opportunity is linked to hypotheses, such as “If we reduce map loading time by 50%, users will spend more time exploring data.” These hypotheses are then tested with solutions like improving server response time and adding customizable data layers. Feedback from users helps refine the tree, leading to prioritized actions that maximize user engagement.


